Auditing an eCommerce website
Slow websites leave money on the table. A slow eCommerce might face a higher customer acquisition cost and a lower average order value than a fast eCommerce.
Speed is not everything though. A website also needs to rank well in search engines and to treat its visitors’ money and data with the utmost care.
In this post I will show you everything I discovered when auditing www.vino.com, an eCommerce where you can shop for wines, beers and spirits.
Is it safe?
The first thing we want to know when auditing a website is whether it is safe or not to browse it. And when we say safe, we mean that it is both secure and respects its users’ privacy.
We can assess the security of a website in various ways, from a quick glance at the Security tab in Chrome DevTools, to a careful inspection of the output of website scanners like twa, to fuzzing for vulnerabilities using Burp Suite.
SSL/TLS certificate
We can start by visiting SSL Server Test and assessing the grade of the SSL/TLS certificate issued for www.vino.com. In this case the grade is A+, the best we can hope for.

Browsers accept three types of SSL/TLS certificates. Certificate authorities (CAs) like DigiCert validate each type of certificate to a different level of user trust. From the lowest level of trust to the highest one, there are:
- Domain Validation (DV)
- Organization Validation (OV)
- Extended Validation (EV)
As we can see, this certificate is of type Extended Validation.

We are off to a good start!
Strict-Transport-Security (HSTS) and HSTS preloading
When users visit a web page served over HTTPS, their connection with the web server is encrypted with TLS. During the TLS handshake, browser and server negotiate which cipher suite they should use to establish a TLS connection. The more updated the version of TLS used by the server (e.g. TLS v1.3), the more safeguarded from sniffers and man-in-the-middle attacks the website users will be.
However, the fact that a web page is served over HTTPS doesn’t necessarily mean that all resources included in that page will be served over HTTPS. For example, a page served over HTTPS may include images, scripts, stylesheets, or other resources served over plain HTTP. This is called mixed content and it’s not good, because it leaves the site vulnerable to downgrade attacks.
Luckily, there is a way to tell browsers to automatically upgrade any HTTP request to HTTPS: the Strict-Transport-Security (HSTS) HTTP response header.
If we have a look at the Network panel in Chrome DevTools, we can see that the web page at www.vino.com is served with a Strict-Transport-Security response header that instructs the browser to keep accessing the site over HTTPS for the next 63,072,000 seconds (i.e. two years).
Server: Apache
Strict-Transport-Security: max-age=63072000
Via: 1.1 google
Even with HSTS, there is still a case where an initial, unencrypted HTTP connection to the website is possible: it’s when the user has a fresh install and connects to the website for the first time. Because of this security issue, Chromium, Edge, and Firefox maintain an HSTS Preload List, and allow websites to be included in this list if they submit a form on hstspreload.org.
As we can see, www.vino.com is preloaded.

However, there is a slight issue with this website. If we check the HSTS preload status of vino.com we see that is not preloaded. This is due to an incorrect redirect, as explained in the second error down below.

Another issue with the Strict-Transport-Security header of this website is that it does not include the includeSubdomains directive. Without that, some resources of some subdomain of vino.com could be served over HTTP. And this leaves the website vulnerable to cookie-related attacks that would otherwise be prevented.
So, ideally, the server should follow the HSTS guidelines and return this header:
Strict-Transport-Security: max-age=63072000; includeSubDomains; preloadContent-Security-Policy (CSP)
Even with HTTPS, a website is still vulnerable to Cross-Site Scripting (XSS) attacks. For example, a malicious script (e.g. a content script of a Chrome Extension) could be injected in the page and executed by the browser.
Today, browsers have a really strong line of defense against this kind of attacks: the Content-Security-Policy (CSP) HTTP response header. This header allows a website to define a set of directives to only allow fetching specific resources, executing specific JS code, connecting to specific origins. Developers design the policy, browsers enforce it.
Unfortunately, a quick scan on Security Headers reveals that www.vino.com does not have a CSP header.
💡 — Writing a good CSP header is not easy. And neither is maintaining it. That's why I created a library that can help you with these tasks.
Permissions-Policy
Ecommerce websites typically have several third-party scripts for ads, analytics and behavioral retargeting. Aside from an impact on performance, these scripts can raise legitimate privacy concerns.
A recent initiative named Privacy Sandbox aims to define solutions that protect people’s privacy and allow final users to opt-in specific browser features by giving an explicit permission via a prompt.
One of the solutions proposed by this initiative is the Permissions-Policy HTTP response header. This header defines a mechanism to allow a website’s developers to selectively enable and disable access to various browser features and APIs. This way a website can set boundaries to protect its users’ privacy by any third-party script.
For example, a website could use the geolocation directive to allow/disallow third-party scripts from interacting with the browser’s Geolocation API.
Permissions-Policy is quite a recent header, so I am not surprised I did not find it on this website.
Vulnerabilities of frontend JavaScript libraries
Most websites depend on some JavaScript library. Likely more than one. Modern JavaScript frameworks like React or Vue are all the rage now, but in reality most of the websites today still use jQuery. This website is one of them.
Using libraries we didn’t write doesn’t mean that their bugs and vulnerabilities are not ours to care about. We should never use a library without auditing it first, and without keeping it up to date. New vulnerabilities are discovered every day, and we should update our libraries to get the latest bug fixes and security patches.
It may not be your fault, but it’s always your responsibility
There are many ways to check the vulnerabilities of a website’s frontend JavaScript dependencies. I like to use a tiny tool called is-website-vulnerable.
If we run this command we can see that this website depends on an old version of jQuery and an old version of Bootstrap.
npx is-website-vulnerable https://www.vino.comsecurity.txt
Even when developers deeply care about security, they can still make mistakes and leave vulnerabilities that an attacker could exploit. It is then a good idea to leave some information for anyone that detected a vulnerability and is willing to disclose it to the website’s owner.
But how to do it? What should the website’s developers do? And how should the person that found the vulnerability contact them? Well, there is a standard for this, and it’s called security.txt.
security.txt is a small text file that should be uploaded to the website’s .well-known directory.
Here are a few examples of security.txt:
It’s a shame most websites don’t have a security.txt. Unfortunately, www.vino.com is one of them.
Data privacy
Online businesses and advertisers would probably like to obtain as many data as possible about their users. However, there are laws in place that protect users’ privacy and limit the amount of information that can be collected.
Two of the most popular pieces of legislation in this matter are the GDPR (General Data Protection Regulation) in Europe and the CCPA (California Consumer Privacy Act) in California.
Violating these laws can result in hefty fines. In case of the GDPR, financial penalties can reach up to 4% of the annual turnover of the non-compliant business.
The GDPR requires a website to obtain explicit consent before collecting personal data or setting identifiers (cookies, keys in localStorage, etc) that could be used to profile the users.
ℹ️ — Recital 30 EU GDPR: Natural persons may be associated with online identifiers provided by their devices, applications, tools and protocols, such as internet protocol addresses, cookie identifiers or other identifiers such as radio frequency identification tags. This may leave traces which, in particular when combined with unique identifiers and other information received by the servers, may be used to create profiles of the natural persons and identify them.
In general, websites use a banner to ask for consent. Here is the consent banner of www.vino.com.

Any connection to a third-party server could result in a violation of the GDPR if the website didn’t obtain the user’s permission first. Even a simple preconnect browser hint like the one below might be considered a non-compliance for the GDPR, if the third-party server processes some information about the user.
<link rel="preconnect" href="third-party-server" />For example, in 2022 a website owner was fined for communicating the visitor’s IP address to Google through the use of Google Fonts.
There are many online tools that can assess a website’s GDPR compliance. A couple that I particularly like are CookieMetrix and 2GDPR. In particular, 2GDPR tells us that on several pages of www.vino.com a few third-party cookies are set before clicking ACCEPT in the consent banner.
Is it easily discoverable?
Search engine crawlers like Googlebot constantly browse the internet and index web pages using an algorithm called PageRank. We don’t know the details of how this algorithm works, but we know that if we structure our web pages in a certain way, and if we include certain files to assist these crawlers in their job, they will assign our pages a better ranking, making our website easier to find by people.
robots.txt
The most important file a website can have to help search engine crawlers in their job, is the robots.txt. This file should be hosted at the root of the website.
If we have a look at https://www.vino.com/robots.txt, we can see that it contains the location of a single sitemap and a few Disallow rules that asks web crawlers to refrain from visiting certain pages.
⚠️ — Every crawler might interpret the robots.txt file differently. For example, this is how Googlebot processes it. A crawler might decide to disregard some (or all) rules completely.
Sitemap/s
One way to tell web crawlers how a website is structured, is to provide one or more sitemaps.
Most websites have a single sitemap.xml, but news websites and huge eCommerces can have more than one. This can be either for necessary reasons (a sitemap.xml can contain a maximum of 50,000 URLs and can be up to 50MB in size), or for SEO reasons (an eCommerce that has a sitemap for each one of its categories—and maybe another one for its images—could achieve a better ranking on search engines).
For example, la Repubblica is the second newspaper in Italy by circulation, and its website has too many URLs to fit a single sitemap. In fact, if we have a look at its robots.txt, we see a sitemap for Rome, another one for Milan, one for Florence, etc…
Sitemap: https://bari.repubblica.it/sitemap.xml
Sitemap: https://bologna.repubblica.it/sitemap.xml
Sitemap: https://firenze.repubblica.it/sitemap.xml
Sitemap: https://genova.repubblica.it/sitemap.xml
Sitemap: https://milano.repubblica.it/sitemap.xml
Sitemap: https://napoli.repubblica.it/sitemap.xml
Sitemap: https://palermo.repubblica.it/sitemap.xml
Sitemap: https://parma.repubblica.it/sitemap.xml
Sitemap: https://roma.repubblica.it/sitemap.xml
Sitemap: https://torino.repubblica.it/sitemap.xml
www.vino.com has a single sitemap that can be found at http://www.vino.com/sitemap.xml.

Its size is well within the size limit of 50MB and contains ~10,000 URLs. However, the website might benefit from creating a sitemap for each category of products (e.g. a sitemap for wines, another one for beers), and one or more sitemaps just for images.
Open Graph Protocol meta tags
Another way to help web crawlers in their job is to add a few Open Graph Protocol <meta> tags. These tags turn a web page into a graph that can be easily processed by parsers and understood by crawlers.
The four required properties for every page are:
og:title- The title of the object as it should appear within the graph.og:type- The type of the object, e.g.websitefor a home page,articlefor a blog post.og:image- An image URL which should represent the object within the graph.og:url- The canonical URL of the object that will be used as its permanent ID in the graph.
We can open the Elements panel in Chrome DevTools and look for these <meta> tags in the <head>, or we can use several online tools like this one by OpenGraph.xyz to check if they are present on the page.
Structured data
Somewhat similar to OGP <meta> tags, a website can add structured data to allow Google converting a web page into a rich result. These data can be expressed in different formats. Google Search supports JSON-LD, Microdata, RDFa.
Websites with many product pages might benefit greatly from including structured data in their markup. In an example reported by Google, Rotten Tomatoes added structured data to 100,000 unique pages and measured a 25% higher click-through rate for pages enhanced with structured data, compared to pages without structured data.
If we use Rich Results Test to check for structured data, we see that the home page of www.vino.com doesn’t have any, while this product page does.

How fast is it, really?
When we want to know how fast a website is, we can either simulate a few website visits, or analyze historical data of real visits.
A simulation can be very close to reality. For example, we can install the WebPageTest Mobile Agent on a real device (e.g. a Moto G4) and visit the website using a real browser. But even in this case, it’s just one visit. Users can have weird combinations of browser, device, viewport size and network connectivity. Simulating all of them is not feasible.
Do we have more luck with historical data? Yes, we do. If a user visits a website using Chrome, the browser records the most important metrics she experiences during her visit, and sends them to the Chrome User Experience Report (CrUX).
It’s impossible to obtain the entire population of real visits to a website. But thanks to CrUX we have access to a reasonably large sample of them.
ℹ️ — Most desktop and mobile users browse the internet using Chrome, maybe save for mobile users in the US, where the market leader seems to be Safari.
Since CrUX data tell us a story about real experiences from real users, we call them field performance data.
Among the metrics collected in CrUX, Barry Pollard says that we should start any performance analysis from the ones called Core Web Vitals (CWV).
Where do we get field performance data?
We can obtain field performance data from the CrUX BigQuery dataset, the CrUX API and the CrUX History API. These data sources follow different schemas and have a different level of granularity. For each query we have in mind, one data source might be more appropriate than another one.
Traffic by device and connectivity, grouped by country
An important question we want to answer is: “where do our users come from?”. Since we don’t have access to the analytics of www.vino.com, we can use CrUX to get an idea of the popularity of the website in different countries. CrUX contains anonymized data, but it keeps the information about the country where the visit originated.
Unsurprisingly, www.vino.com is most popular in Italy. According to the data from CrUX, it seems much more users visited the website using phones rather than desktops or tablets. Almost 74% of the traffic that originated from Italy in the trimester from April to June 2023 came from phones. 96% of these connections were 4G or better.
| country | coarse popularity | desktop traffic | phone traffic | tablet traffic | 4G percentage | 3G percentage |
|---|---|---|---|---|---|---|
| Italy | 5000 | 23.60 | 73.82 | 1.58 | 96.13 | 2.87 |
| Belgium | 36667 | 26.90 | 68.24 | 3.93 | 97.52 | 1.49 |
| Luxembourg | 36667 | 0 | 33 | 0 | 33 | 0 |
| Sweden | 50000 | 20.82 | 78.14 | 0 | 98.97 | 0 |
| Germany | 50000 | 17.29 | 77.72 | 4.06 | 97.25 | 1.82 |
⚠️ — A phone connected to a WiFi network is still a phone, but has a much better connectivity than the same phone connected to the a cell network. Don't forget this when interpreting that 4G percentage in the table.
Performance metrics over time
Knowing which countries and devices the traffic comes from is key. It suggests us to focus on metrics recorded for this combination of factors. It would be pointless to look at the performance of www.vino.com on tablets in the UK, if we know that the website is mostly visited from phones, from Italy.
TTFB
I agree with Barry that Core Web Vitals are really important, but there is another metric that is absolutely crucial for web performance: Time To First Byte (TTFB).
The thing is, we can’t really optimize for TTFB, because TTFB is the sum of the many things:
- HTTP redirects
- Service worker’s startup time
- DNS lookup
- Connection and TLS negotiation
- Request, up until the point at which the first byte of the response has arrived
Also, is not always appropriate to compare the TTFB of a website built with one technology (e.g. client-side rendering), to the TTFB of another website built with a different technology (e.g. server-side rendering).
But there is one thing we can say by looking at the value of TTFB: if it’s bad, we know we have some work to do.
While a good TTFB doesn’t necessarily mean you will have a fast website, a bad TTFB almost certainly guarantees a slow one.
I created a tool that allows me to obtain data from CrUX (both the CrUX BigQuery dataset and the CrUX History API) without ever leaving Google Sheets. Let’s start with TTFB.
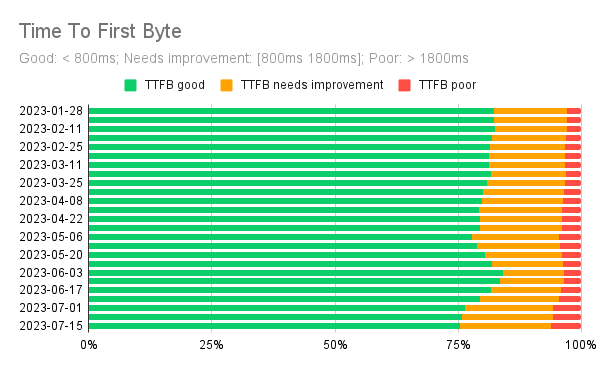
Six months of historical field performance data show that TTFB has been good for over 75% of the phone users.
In the timeline chart below we can see that even if TTFB started degrading a bit after mid-June 2023, its 75th percentile value is still below the threshold of what Google defines as good TTFB: 800ms.
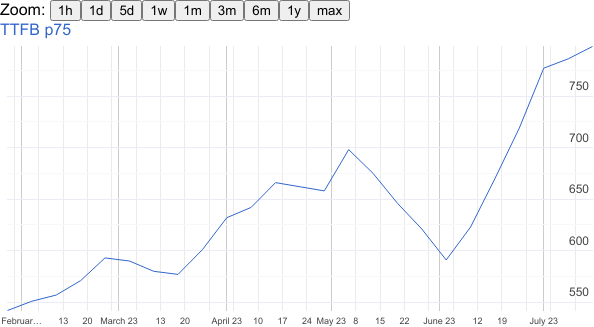
It would be interesting to know why the website reached its best TTFB in early June and then started to worsen. But it’s hard to tell without having more information about the infrastructure the website is built on, and in general where the backend spends its time (e.g. cache hit/miss ratio on the CDN, CPU utilization and memory footprint on the server, etc).
Had CrUX reported a poor TTFB for the website, I would have suggested using the Server-Timing HTTP response header to understand where the backend spends its time.
FCP
The first thing a user sees after having requested a web page, is a blank screen. Until the browser renders something on the page, the user doesn’t know if the page is really loading, if there are connection issues, or simply if the website is broken. There are basically two interpretations about this something, hence two very similar metrics: Start Render and First Contentful Paint (FCP).
There are some differences in what Start Render and FCP consider DOM content, but the important thing is that they basically mark the end of the blank screen.
The best tool that shows when FCP occurs is the Details section of WebPageTest. For example, down below we can see that the FCP element is a small gray <div> that belong to the website banner and appears at ~2.3 seconds (the rest of the banner appears much later).
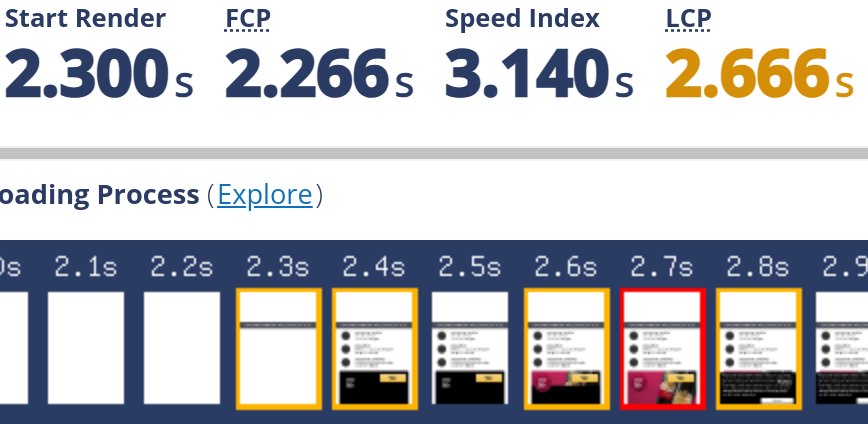
The value of FCP here (2.266 seconds) is actually worse than the 75th percentile of FCP of the last six months of data extracted from CrUX. I think this is due to an excessive network throttling performed by the WebPageTest configuration profile I chose. I instructed WebPageTest to run this audit using a server in Milan, simulating a Google Pixel 2 XL with a 4G connection.
Here is the timeline of FCP experienced by real users over a period of six months.

ℹ️ — Several articles about web performance often run a performance audit on a Moto G4. I argue that nowadays most users have a more powerful device. Google Pixel 2 XL was once a really good smartphone, but in 2023 I would consider it low-mid tier, so a good option for performance audits. Probably it's even a bit too conservative option, as we have just saw.
LCP
Rendering some DOM content as soon as possible is important. But arguably more important is to render the largest DOM content in the viewport.
When a user sees the biggest element on the screen, she perceives that the page loads fast and it is useful. The metric that tracks this moment is called Largest Contentful Paint (LCP).
Down below you can see six months of data of FCP vs LCP extracted from CrUX.
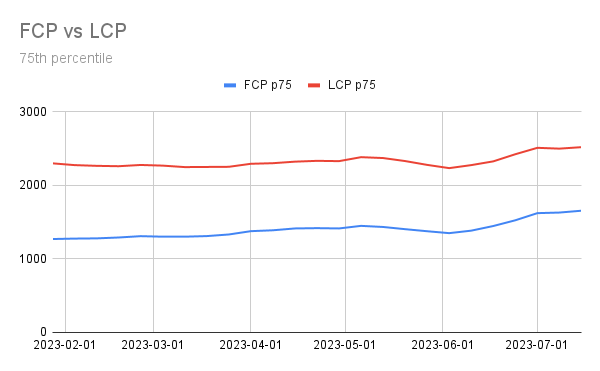
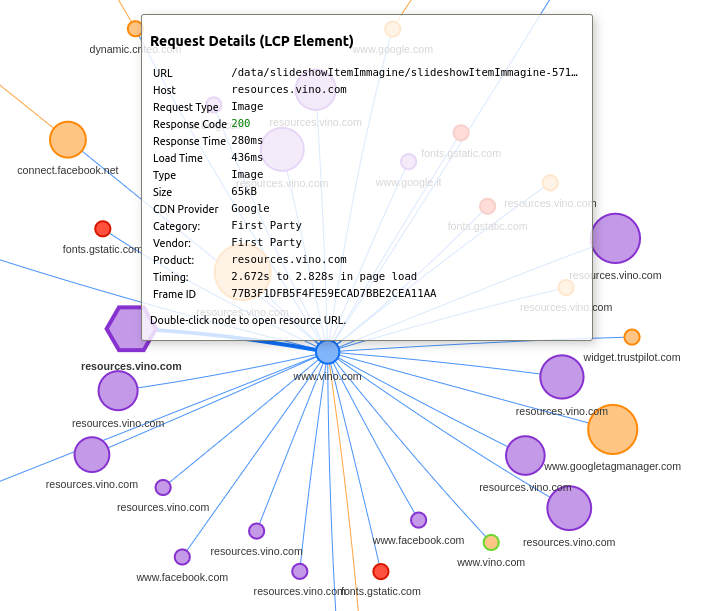
The best tool that shows when LCP occurs is the Performance Insights panel of Chrome DevTools. As we can see, in this case the LCP element is one of the product images.

We can also understand what the LCP element is, using another tool: Request Mapper.
CLS
When a browser renders a page, it has to figure out where to place each element. Ideally, once it has established where to position the elements, we shouldn’t cause it to rearrange them. Failing to do so might be ok and might even be required for a particular page, but these adjustments add up and can cause a bad user experience.
Cumulative Layout Shift is a metric that take into account such rearrangements in the page (layout shifts). Its definition is quite complex, but the idea is simple: to offer a good user experience, a web page needs to have a good layout stability.
💡 — You can click/tap to pause this video and use the horizontal scrollbar or the left/right arrow keys. Try to pause at 3.4s to observe a Flash Of Unstyled Text (FOUT).
The Web Vitals section of a WebPageTest audit highlights in red all layout shifts occurring in two adjacent frames.
I ran the test on WebPageTest using this script, to simulate a user that accepts the cookies in the consent banner.
setEventName loadPage
navigate %URL%
setEventName acceptCookies
execAndWait document.querySelector('#info-cookies button').click()
We can see that the banner disappears, but there is no other effect on the page layout.
By the look of these videos, we can say the layout is very stable, so we expect CLS to be quite good. In fact, the last six months of field performance show that CLS has indeed been very good on phones (and also on desktops and tablets, not shown here).
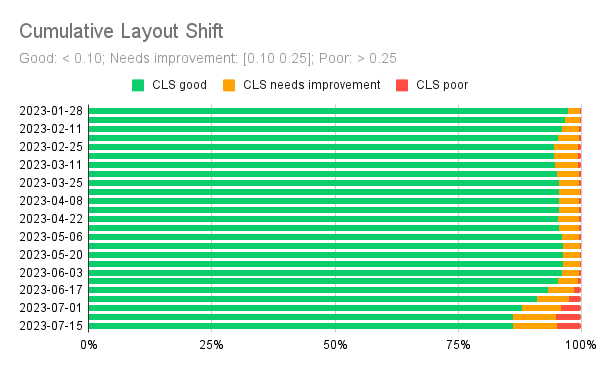
Again, we notice a slight degradation starting from June 2023, but the 75th percentile value of CLS is still well below the threshold of what Google defines as good CLS: 0.1.

How is it made?
Now that we have seen how the home page of www.vino.com performs in the real world, we can have a look at how it is made. That is, we want to know:
- which assets are on this page
- where they are hosted
- when they are requested
- who requests them
To answer these questions we are going to use a variety of tools: Chrome DevTools, Request Mapper, REDbot, WebPageTest. But first we need to find a way to dismiss the consent banner programmatically, because we need to analyze the HTTP requests before and after a user expresses her consent.
Before and after consent
Even before expressing our consent, the website sets a few cookies. We can inspect them in Chrome DevTools > Application > Cookies.

This is not great. In particular, that cto_bundle is a third-party cookie set by criteo, a service that performs behavioral retargeting. That _gcl_au is a cookie set by Google AdWords. And those cookies that start with _ga are set by Google Analytics.
I don’t think that setting any of those cookies before asking for consent is going to fly with the GDPR.
ℹ️ — Recital 24 EU GDPR: […] In order to determine whether a processing activity can be considered to monitor the behaviour of data subjects, it should be ascertained whether natural persons are tracked on the internet including potential subsequent use of personal data processing techniques which consist of profiling a natural person, particularly in order to take decisions concerning her or him or for analysing or predicting her or his personal preferences, behaviours and attitudes.
But let’s proceed and see what happens after we click ACCEPT in the consent banner and allow the website to process the cookies as stated in its cookie policy. If we type this code in the browser’s console, the consent banner disappears.
document.querySelector('#info-cookies button').click()We can see that a new acceptCookies cookie appears, and its value is set to true.

Visualize HTTP requests
To give actionable advice on how to improve the web performance of a page, we need to examine the HTTP requests of that page.
We could study each HTTP request in detail using the Waterfall in Chrome DevTools or the one in WebPageTest, but I think it’s better to have first an overview of how the browser makes these requests. The best tool for this job is Request Mapper.
Before accepting the cookies
If we plot the request map of www.vino.com we see a bunch of small images, some fonts, a couple of CSS files, and a few, big JavaScript files.
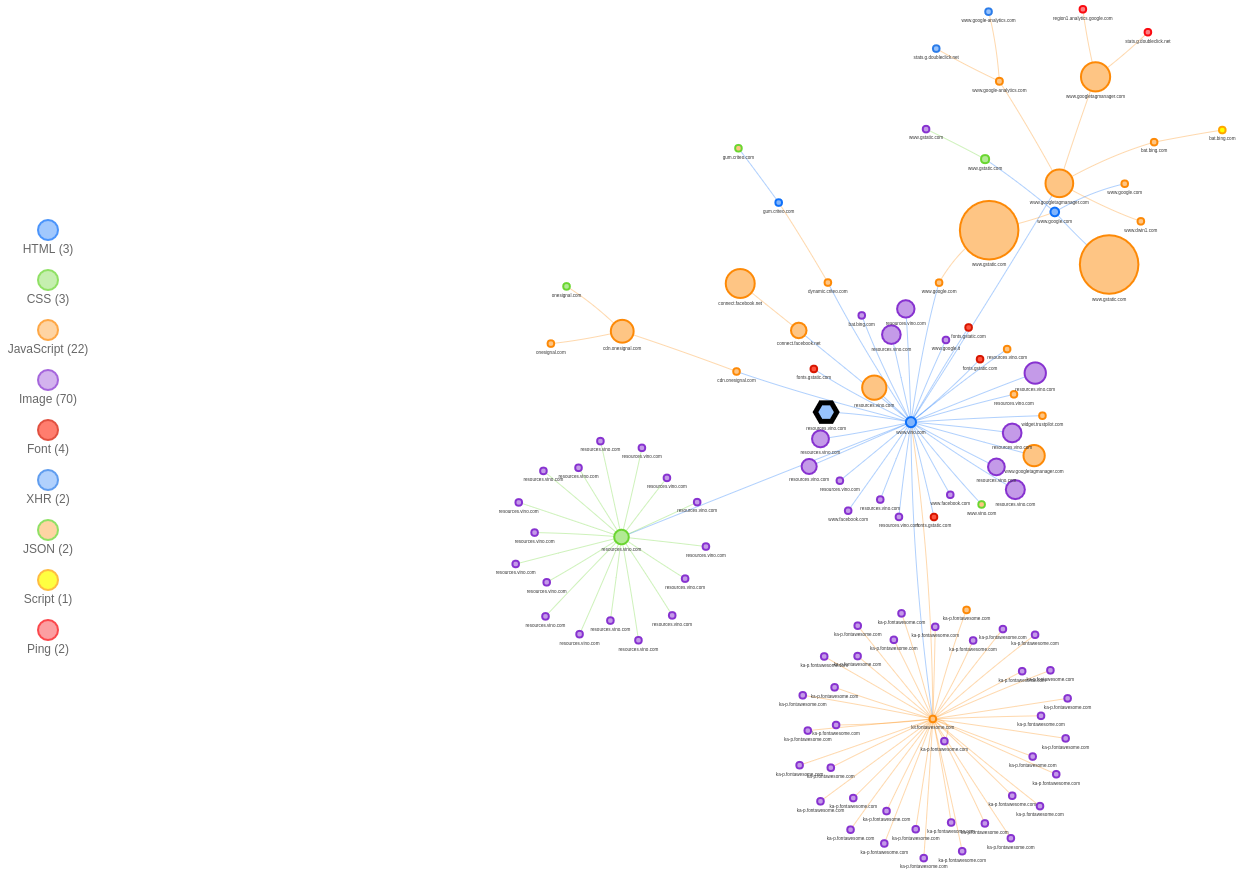
We also notice four clusters of requests. The center of each cluster is important because it’s both the origin and the bottleneck for the requests of that cluster.
The browser starts parsing the file that sits at the center of the cluster, then gradually discovers other resources to fetch. We see arrows coming out from the main HTML document and requesting JavaScript and CSS assets first, and images and fonts later.
The green circle in the center-left cluster is the single CSS bundle of the website. It’s rather big (~44 kB) because the site has Bootstrap as a dependency. When the browser parses that CSS, it discovers it needs to fetch other images. These images are hosted at resources.vino.com.

The orange circle in the lower-right cluster is the JavaScript snippet for Font Awesome. It includes several SVG icons. As soon as the browser sees them, it starts fetching them. These SVGs are hosted at ka-p.fontawesome.com, the Font Awesome CDN which runs on the Cloudflare network.

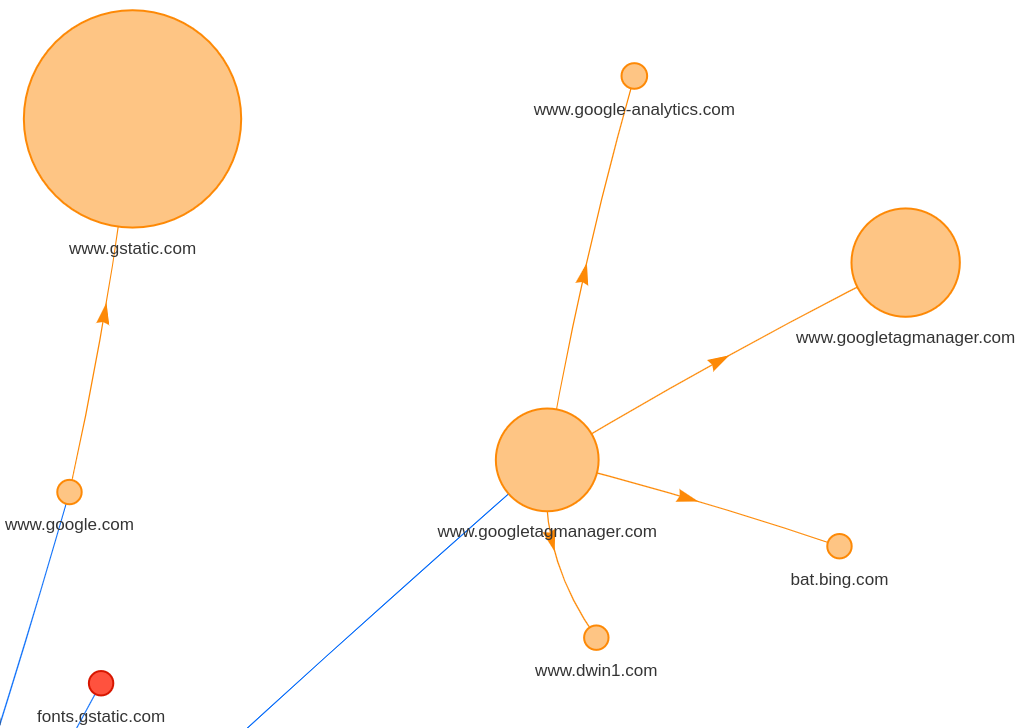
The big, orange circles in the upper-right cluster are JS snippets for reCAPTCHA (left) and Google Tag Manager (center and right). Google Tag Manager then requests its tags.
In total on this page there are a bit more than 100 HTTP requests. Most for images (JPEGs and SVGs) and JS files.
| MIME type | Requests |
|---|---|
| image | 64 |
| js | 23 |
| other | 9 |
| font | 4 |
| css | 3 |
| html | 3 |
| MIME type | Bytes |
|---|---|
| js | 974892 |
| image | 560041 |
| css | 78014 |
| html | 64722 |
| font | 48128 |
| other | 510 |
If we look at the WebPageTest Connection view down below, we can see that the browser needs to perform quite a bit of work to process these requests, not so much for the required bandwidth, as for the JavaScript execution. We can see that CPU utilization stays high all the time and the main thread is overworked, with a lot of spikes due to JS execution, and many long tasks.

After accepting the cookies
After the user accepts the cookies, a few other requests are made. They are for a couple of JS snippets and a tracking pixel set by Meta Pixel.
| MIME type | Requests |
|---|---|
| js | 2 |
| other | 2 |
| image | 1 |
| MIME type | Bytes |
|---|---|
| js | 4782 |
| image | 43 |
There are very few bytes to download this time, so the Bandwidth In line is almost flat. The browser still needs to execute some JavaScript though, so CPU utilization does not stay flat. Luckily there is not that much JavaScript this time, so there are no long tasks.
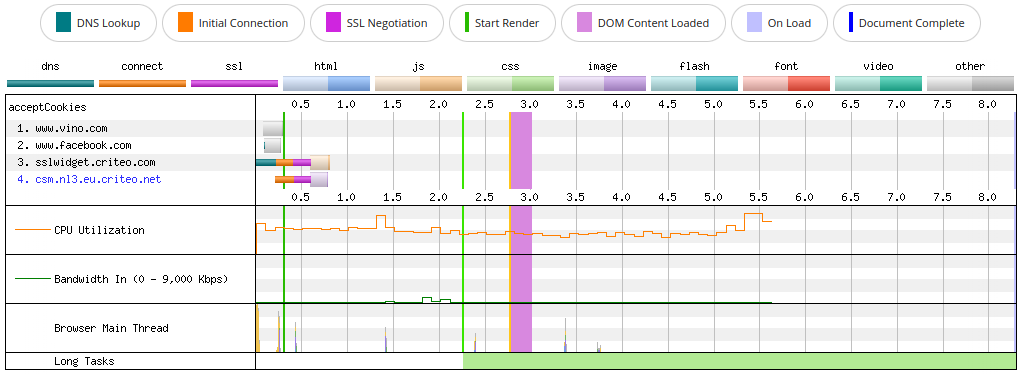
Main HTML document
We can make a HEAD request for the main HTML document using curl in verbose mode.
curl https://www.vino.com/ --head --verboseWe see that curl establishes an HTTP/2 connection:
*   Trying 35.241.26.2:443...
* Connected to www.vino.com (35.241.26.2) port 443 (#0)
* ALPN, offering h2
* ALPN, offering http/1.1
* ALPN, server accepted to use h2
* Using HTTP2, server supports multiplexing
# other output from curl not shown here...
Among the HTTP response headers, we notice this one:
# other output from curl not shown here...
via: 1.1 google
# other output from curl not shown here...
This header is set by a target proxy, a piece of configuration of an Application Load Balancer deployed on Google Cloud Platform (GCP).
GCP Application Load Balancers support HTTP/3. So, why don’t we see a HTTP/3 connection here? Two reasons.
First, HTTP/3 support in curl is still experimental, and we would have to compile curl from source to enable it.
Second, clients don’t immediately connect to a server using HTTP/3. Instead, the server advertises its support for HTTP/3 and the versions of QUIC it supports using the Alt-Svc header. In fact, the last line of the output looks like this:
# other output from curl not shown here...
alt-svc: h3=":443"; ma=2592000,h3-29=":443"; ma=2592000
Chrome and all major browsers have been supporting HTTP/3 for quite some time now, but their first connection with an HTTP/3-compatible server will still occur over HTTP/2. We can see this by examining the first request in the WebPageTest waterfall.

Only after the browser has seen the alt-svc header and fetched a few resources over HTTP/2, it will try to establish an HTTP/3 connection with the server.

The first time the browser tries to establish a HTTP/3 connection, it performs a technique called connection racing, and in Chrome DevTools we see this (the tooltip says won a race…):

After the browser has managed to connect to the server using HTTP/3, this race should no longer be necessary. In fact, in Chrome DevTools we see this (the tooltip says without racing…):

Static assets (Cloud Storage and Cloud CDN)
This website hosts its static assets on Cloud Storage. We can understand this by looking at the HTTP response headers of any request to resources.vino.com. For example, the favicon.
We can also see that Cloud Storage supports HTTP/3 and advertises this fact using the alt-svc header.
HTTP/1.1 200 OK
X-GUploader-UploadID: ADPycduJHAFYnABaw_53rnmGyt4VqCyh07sZzJ4nwRNgtKmlZhYqRn
        mnlkks0qBg7pxKOVGjCZ3RgNgVETVeN6DkFWWJQg
Date: Mon, 07 Aug 2023 08:28:03 GMT
Last-Modified: Tue, 01 Aug 2023 11:58:03 GMT
ETag: "60454b7416845dc9281f707413c9a2f9"
x-goog-generation: 1690891083048549
x-goog-metageneration: 1
x-goog-stored-content-encoding: identity
x-goog-stored-content-length: 15086
Content-Type: image/vnd.microsoft.icon
Content-Language: en
x-goog-hash: crc32c=0l6J2A==
x-goog-hash: md5=YEVLdBaEXckoH3B0E8mi+Q==
x-goog-storage-class: COLDLINE
Accept-Ranges: bytes
Content-Length: 15086
Vary: Origin
Server: UploadServer
Cache-Control: public,max-age=3600
Alt-Svc: h3=":443"; ma=2592000,h3-29=":443"; ma=2592000
The first few connections to Cloud Storage will be over HTTP/2…

…and only after some successful fetches, the browser will try to switch to HTTP/3.

Cloud Storage files are organized into buckets. When you create a bucket, you specify its geographic location and choose a default storage class. The class they decided to use for the website’s assets is COLDINE.
I find it rather odd that they opted for COLDLINE as the storage class. Its main use case is for infrequently accessed data. For website content I would have expected to find STANDARD.
ℹ️ — You can store different classes of an object in the same bucket, but I had a look at several assets of this website and they all seem to use COLDLINE as their storage class.
A bucket’s location can be a single region, a dual-region or a multi-region. In a multi-region, all assets of the bucket are replicated in many datacenters across that region (Asia, Europe, US). However, if we want to guarantee a fast delivery to all areas of the planet, we have to use a Content Delivery Network (CDN).
I don’t think there is a sure way to prove that this website uses Cloud CDN, but I have a strong suspicion that it does. I came to this conclusion by performing several tests on WebPageTest, from different locations, and by looking at the Time to First Byte and Content Download times of the same asset: the favicon. All of these requests are on a HTTP/3 connection.
| Location | TTFB | Content Download |
|---|---|---|
| Dulles (Virginia) | 175 ms | 14 ms |
| Milan (Italy) | 175 ms | 13 ms |
| Melbourne (Australia) | 188 ms | 13 ms |
Given that it takes 76 ms for the light to travel from Milan to Melbourne (in fiber), I think that it’s safe to assume that not even a multi-region bucket (e.g. in Europe) would be enough to guarantee this kind of performance for a user in Melbourne. This means that either they copy all assets from one bucket to another one using some mechanism they implemented, or they rely on a CDN. Most likely, they use Cloud CDN to automatically replicate the assets from a Cloud Storage bucket in Europe to an edge Point of Presence (PoP) close to Melbourne.
Cloud CDN allows to add custom headers before sending the response to the client. However, it seems this feature is not used here.
Caching
Every time a user navigates to a page of a website that uses both Cloud Storage and Cloud CDN, these things might happen:
- The browser might find the entire snapshot of the web page in memory. This can happen if the website is eligible to use the Back/forward cache and the user already visited the page a few seconds before.
- The browser might find some resources in its memory cache.
- The browser might have some requests “hijacked” by a service worker that previously stored them using the CacheStorage interface (either at the service worker installation time, or at runtime).
- The browser might find some resources in its HTTP Cache (aka disk cache).
- The browser might find some resources on Cloud CDN and fetch them from the closest Point of Presence.
- The browser might have to fetch some resources from the Cloud Storage bucket.
We saw that www.vino.com hosts its own static assets on resources.vino.com and that those assets are on Cloud Storage. Let’s also assume they are replicated on Cloud CDN. There are a few other things we can say.
The browser cannot use its back/forward cache on this website because the main HTML document of www.vino.com is served with the Cache-Control: no-store, and because there are two unload events in the page.

There is a Web App Manifest, but the website doesn’t install any service worker. That Cache-Control: no-store header returned with the main HTML document always forces the browser to hit the network, so I don’t think this manifest.json serves any purpose: the website is not a Progressive Web App.
Cloud Storage allows to configure a Cache-Control metadata in the same way we might configure the directives of the Cache-Control HTTP header. If we check a few images hosted at resources.vino.com, we see they are served with this Cache-Control header.
Cache-Control: public,max-age=3600
# other headers not shown here...
This combination of cache directives (public,max-age=3600) is the default value for unencrypted content on a Cloud Storage bucket.
Unfortunately we can’t say for sure that these assets are cacheable for 3600 seconds (1 hour) because Cloud CDN has its own caching behavior. In fact, Cloud CDN has three cache modes and it can either honor or disregard the Cache-Control directives.
The main HTML document is served with a Cache-Control header that includes a no-store directive. This is problematic because that no-store directive prevents the browser from using the back/forward cache, makes it hit the network any time it requests the page, and always causes the load balancer (see that 1.1 google) to request the HTML document from the origin server (Apache in this case).
Server: Apache
Cache-Control: no-cache, no-store, max-age=0, must-revalidate
Vary: Accept-Encoding
Via: 1.1 google
# other headers not shown here...
I think a more reasonable Cache-Control header could be something like this:
Cache-Control: must-revalidate, max-age=120This combination of Cache-Control directives tells the browser that if it requests the HTML document within 120 seconds, it can use the cached version. After 120 seconds, the browser must revalidate the cached version against the origin server. If the origin server returns a 304 Not Modified response, the browser implicitly redirects to the cached version. If the origin server returns a 200 OK response, the browser must use the new version.
Images
As I wrote in a previous article, optimizing images is crucial for performance, SEO and accessibility.
There are a lot of images on the home page of www.vino.com. The MIME type breakdown table shows that on a first visit, roughly 600 kB of data are images. This is not terrible, but there is certainly room for improvement. There are a few changes we could make.
WebP and AVIF
First of all, the images in the home page are JPEG. We can save a lot of bytes if we serve WebP or AVIF instead.
ℹ️ — Microsoft Edge doesn't yet support AVIF, but one of its canary releases seems to support it, so I guess AVIF support in Edge is near.
<img> with an appropriate alt attribute
Second, most of the images on the home page are background images, meaning they are URL in a background-image CSS property. The simplified HTML markup for one of these images looks like this:
<div>
  <a href="selezione/serena-1881">
    <div>
      <div style="background-image: url(https://resources.vino.com/data/slideshowItemImmagine/slideshowItemImmagine-6583.jpg);"></div>
      <div>Serena 1881</div>
    </div>
  </a>
</div>
This is a problem because background images are not accessible. Without an <img> element with a proper alt attribute, these images are completely invisible to screen readers.
Not having <img> elements with an alt attribute is also an issue from a SEO standpoint. The alt attribute should be used to describe the image and contextualize it in the page.
Resolution switching
Third, we could serve lower resolution images to smaller viewports. This is called resolution switching and involves generating several versions of the same image at different resolutions, and letting the browser decide what to download using the srcset and sizes attributes of the <img> element.
Low Quality Image Placeholder (LQIP)
Each product card on the home page includes the product’s title and description, two badges that tell us the discount and deadline for the offer, and a black image. The black image is then swapped for the actual image of the product.
Here is how the home page looks when loading with a Fast 3G connection (I used Network throttling in Chrome DevTools).
A better user experience would be to avoid showing a black image, and use a Low Quality Image Placeholder (LQIP) instead.
SVG icons
WebPageTest can show us the number of requests made to each domain, and can tell us how many bytes were downloaded from each domain. This information is available in the Connection view and in the two Domains Breakdown tables.
The first Domains Breakdown table shows the number of requests per domain.
| Domain | Requests |
|---|---|
| ka-p.fontawesome.com | 39 |
| resources.vino.com | 32 |
| fonts.gstatic.com | 4 |
| www.gstatic.com | 4 |
| www.google.com | 3 |
| bat.bing.com | 3 |
| www.googletagmanager.com | 3 |
| www.facebook.com | 2 |
| onesignal.com | 2 |
| cdn.onesignal.com | 2 |
| gum.criteo.com | 2 |
| www.vino.com | 2 |
| www.google-analytics.com | 2 |
| stats.g.doubleclick.net | 2 |
| connect.facebook.net | 2 |
| others | 6 |
We can see that when we visit www.vino.com (before accepting or dismissing the consent banner), the browser makes two requests to www.vino.com, and 32 to resources.vino.com. Since the website’s owner controls these domains, we call these requests first-party requests. All other requests the browser makes are towards domains the website’s owner doesn’t control, so we call them third-party requests. In general it’s a good idea to self-host our static assets.
Those 39 requests to ka-p.fontawesome.com are third-party requests that the browser makes to download all SVG icons of the website. SVG icons are in general quite small in size, so those 39 requests account for only 34 KB of data.

The second Domains Breakdown table shows how many bytes are downloaded per domain.
| Domain | Bytes |
|---|---|
| resources.vino.com | 702353 |
| www.gstatic.com | 383005 |
| www.googletagmanager.com | 238256 |
| connect.facebook.net | 136183 |
| cdn.onesignal.com | 72234 |
| fonts.gstatic.com | 48128 |
| ka-p.fontawesome.com | 34045 |
| www.vino.com | 30944 |
| www.google.com | 27159 |
| www.google-analytics.com | 20998 |
| others | 72823 |
resources.vino.com hosts most of the high-res JPEG images of the website, so it’s not surprising that most of the data comes from this domain.
All assets of ka-p.fontawesome.com are hosted on the Font Awesome CDN, which itself runs on Cloudflare. We know this because each request to an SVG icon of the website returns these headers:
CF-Cache-Status: HIT
Server: cloudflare
CF-RAY: 7f4772a43e05faf0-SJC
# other headers not shown here...
Making 39 requests to a third-party domain just to download the website’s icons seems a bit wasteful. I would create a single SVG sprite of all the icons and self-host it on resources.vino.com.
💡 — You can use svg-sprite to create an SVG sprite.
Requests in HTTP/2 are cheap thanks to multiplexing, so we might not gain a lot in performance by reducing them from 39 (the individual 39 SVG icons) to one (the single SVG sprite). But eliminating a third party domain means the browser has one less DNS lookup to do, one less TLS handshake to perform, and one less TCP connection to open. These costs add up, so we should see a performance improvement if we avoid them. Also, by hosting an asset on a domain we own, we have full control on the caching policy for that particular asset.
Fonts
Other third-party assets found on this website are the Google Fonts, which are hosted on fonts.gstatic.com and they are served with these HTTP response headers:
Server: sffe
Cache-Control: public, max-age=31536000
Content-Type: font/woff2
# other headers not shown here...
Both the font format (woff2) and the caching policy are fine (these assets can be cached for up to one year), but as I said before, we can’t connect to a third-party domain without obtaining the user’s consent first. We can avoid regulatory issues and save us another DNS lookup + TLS handshake + TCP connection by self-hosting all fonts on resources.vino.com.
Meta Pixel
This website use Meta Pixel, a tool that I have no doubt is really useful to the marketing department.
If we zoom in on the request map, we can see that the website loads the JS snippet and the tracking pixel directly. For a better performance, a common recommendation is to let Google Tag Manager load these files for us.
Another potential issue is that the JS snippet is downloaded when the consent banner is still on screen. This might be ok, as long as the website doesn’t send any data to Facebook before obtaining the user’s consent.
Fighting bots
This website uses reCAPTCHA to fight bot traffic and tell humans and bots apart.
The first big problem with reCAPTCHA is its impact on the website’s performance, especially on low-end mobile devices. The Lighthouse Treemap down below shows that the reCAPTCHA snippet adds 433.753 KiB di JS. Even worse, the Coverage column tells us that almost half of that JS is unused.

The second big problem with reCAPTCHA is that it’s a Google’s service. Google makes money by selling ads, but every bot identified by reCAPTCHA directly reduces Google’s ad revenue. Google gives up some revenue every time reCAPTCHA does its job, so improving reCAPTCHA’s anti-bot capabilities too much doesn’t really make sense for them.
But fighting bots is important, so we can’t really drop reCAPTCHA without replacing it with an alternative.
It’s hard to make recommendations here, but I think that an appropriate solution could be hCaptcha, or some service that stops bot traffic at the edge, like Google Cloud Armor or Cloudflare Bot Management.
How can we improve it?
Improving a website is an iterative process that goes like this:
- observe the current situation
- raise a question
- formulate a hypothesis
- run an experiment to test the hypothesis
- draw a conclusion
- approve or reject change
- repeat
By looking at charts like the Waterfall View and the Connection View in WebPageTest, we can come up with hypotheses to make a website faster, leaner or more resilient. By running a few performance experiments, we can test such hypotheses.
Self-host Google fonts
The home page of www.vino.com uses a few web fonts from Google Fonts. More precisely, it requests one variant of Open Sans and three variants of Montserrat from fonts.gstatic.com.
We can simulate an outage of the Google Fonts service by directing the host fonts.gstatic.com to the WebPageTest’s blackhole server, which will hang indefinitely until timing out. Chrome will give up after roughly 30 seconds and it will print a ERR_CONNECTION_TIMED_OUT error in the console for each connection it did not manage to establish.

If we have a look at the WebPageTest Connection View, we notice a huge gap where almost nothing happens: the Bandwidth In chart is flat, the Browser Main Thread chart shows very little activity, the CPU utilization chart stays at roughly 50%. The browser keeps trying to connect to fonts.gstatic.com, so even if the DOMContentLoaded event fires right after 3 seconds, the load event takes much longer and fires only at around 34 seconds.
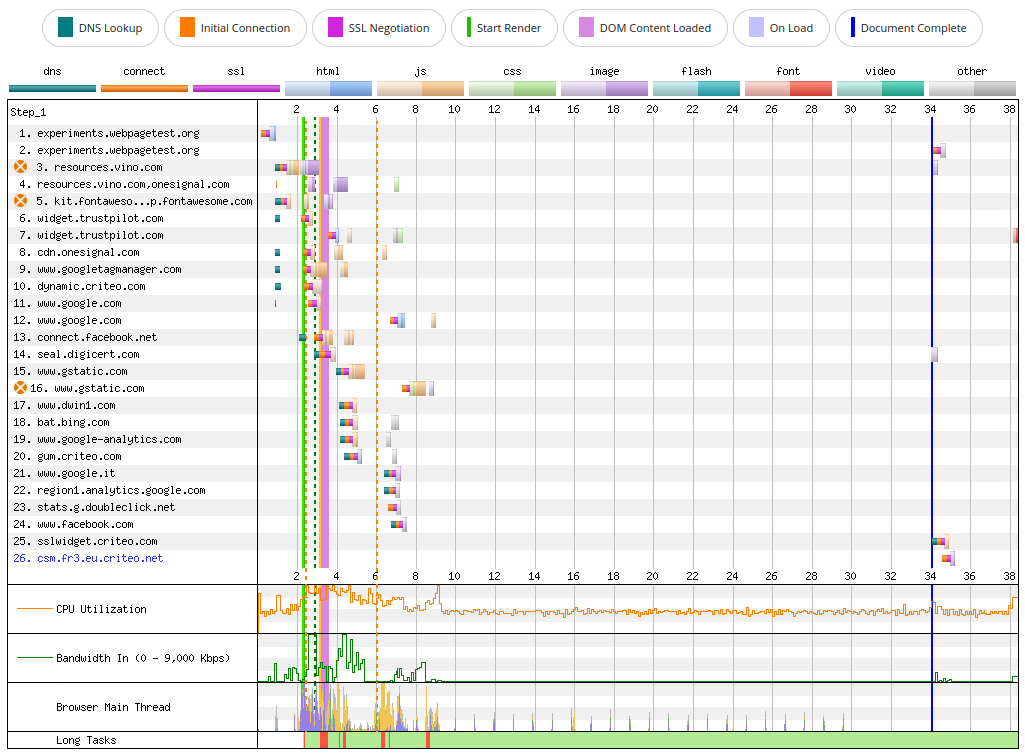
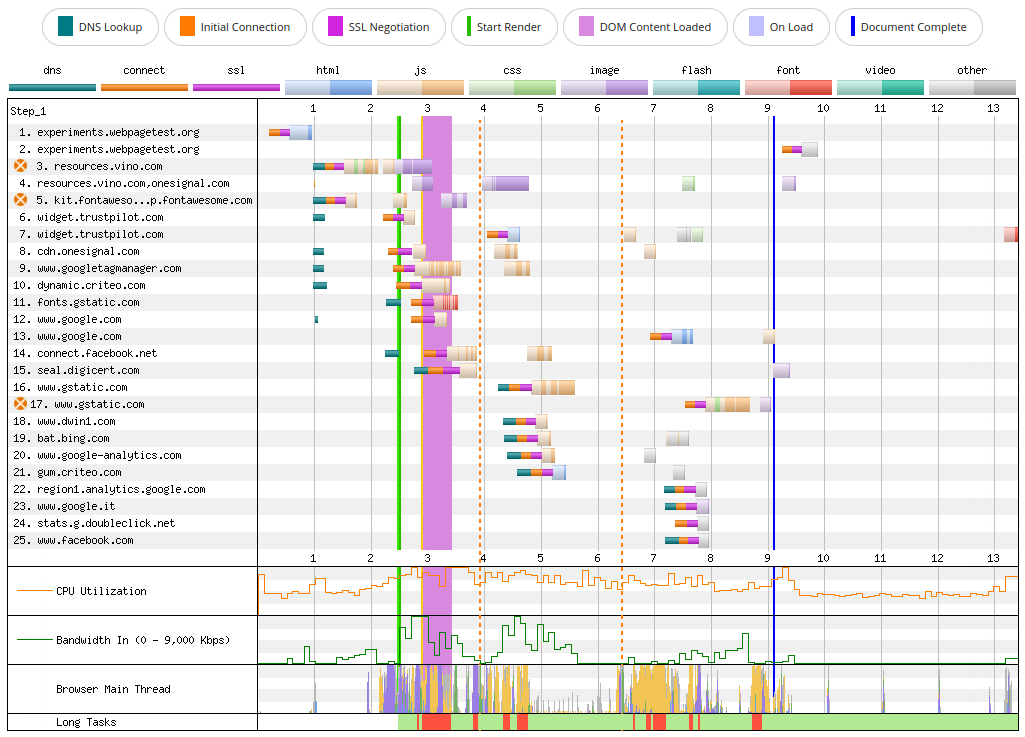
For comparison, the WebPageTest Connection View shows no gaps when the browser manages to connect to fonts.gstatic.com without issues.
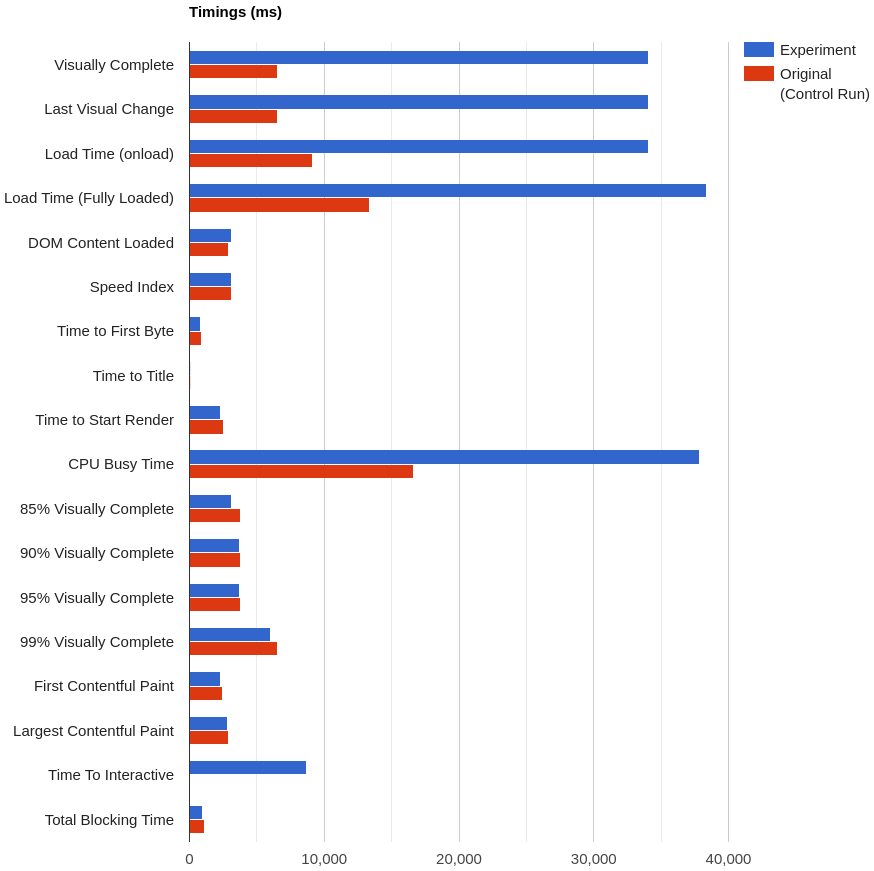
The (simulated) outage of fonts.gstatic.com causes Load Time and CPU Busy Time to take almost 30 seconds longer than the usual.
It could be worse though. It’s true that when the browser can’t connect to fonts.gstatic.com it can’t get Open Sans or Montserrat, but this website have CSS declarations like this one:
font-family: montserrat, sans-serif;This tells the browser that it can fallback to a generic sans-serif system font if montserrat is not available. Also, this website includes a few @font-face rules like this one:
<style>
  @font-face {
    font-family: 'Montserrat';
    font-style: normal;
    font-weight: 700;
    src: local('Montserrat Bold'), local('Montserrat-Bold'), url(https://fonts.gstatic.com/s/montserrat/v12/JTURjIg1_i6t8kCHKm45_dJE3gnD_vx3rCs.woff2) format('woff2');
    unicode-range: U+0000-00FF, U+0131, U+0152-0153, U+02BB-02BC, U+02C6, U+02DA, U+02DC, U+2000-206F, U+2074, U+20AC, U+2122, U+2191, U+2193, U+2212, U+2215, U+FEFF, U+FFFD;
    font-display: swap;
  }
  /* other font-face rules not shown here... */
</style>
That font-display: swap; is important, because it tells the browser to immediately render the fallback font (i.e. sans-serif) and swap it with Montserrat when it’s ready. If the browser can’t connect to fonts.gstatic.com, it will never use Montserrat, but it will not block rendering.
However, why should we leave our four Google Fonts on fonts.gstatic.com, wasting a DNS lookup, a TCP connection and a TLS handshake to connect to it? It’s better to self-host them on www.vino.com or resources.vino.com.
Self-host Font Awesome
This website uses a Font Awesome Kit for its SVG icons. Using a kit involves fetching a JS script, and letting this script request all the SVG icons included in the kit. We can see this in the Font Awesome cluster described above. This kit is hosted at kit.fontawesome.com.
We can simulate an outage of the Font Awesome service in the same way we did for Google Fonts. Once again, Chrome will give up after roughly 30 seconds and it will print a ERR_CONNECTION_TIMED_OUT error in the console.

However, the impact on performance is much worse this time. Failing to connect to kit.fontawesome.com delays Start Render and First Contentful Paint by roughly 30 seconds. We can see this either in the WebPageTest Waterfall View…
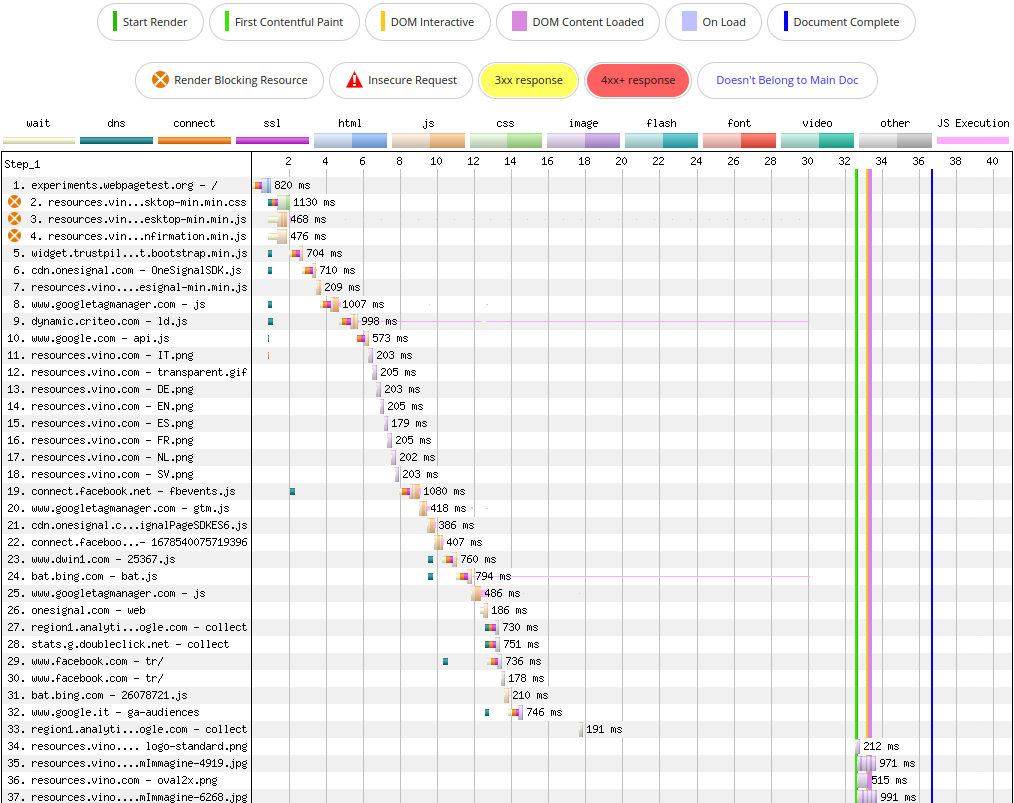
…or in the summary report of the control run versus the experiment run of this performance experiment.

The reason for this huge degradation in performance is that the snippet hosted at kit.fontawesome.com is render-blocking.

Chrome blocks rendering until it gives up connecting to kit.fontawesome.com. Only then it starts rendering the page.
In the screenshot below, the black circle would normally include the icon of a truck, but since the browser can’t connect to kit.fontawesome.com, it can’t fetch any SVG icon from the Font Awesome Kit.
Just like we did for Google Fonts, it makes sense to self-host this Font Awesome Kit as well.
Avoid redirects using Cache-Control: immutable
During the first visit to the home page, the browser caches all assets hosted at resources.vino.com (CSS, JS, images) because they are served with this Cache-Control header.
Cache-Control: public, max-age=3600However, if we have a look at the WebPageTest Waterfall View of a repeat visit, we notice many redirects (the rows in yellow).

Each HTTP 304 redirect means that the browser revalidated the resource against the server, and since the resource did not change (that’s why it is called 304 Not Modified), the browser performed an implicit redirection to the cached version.
The thing is, these redirects introduce a performance penalty which sometimes can be rather significant.
Images hosted at resources.vino.com will likely never change, so we can tell the browser to cache them for one year and to never revalidate them against the server. We can achieve this by serving the images with this Cache-Control header.
Cache-Control: public, max-age=31536000, immutableThat immutable directive instructs the browser to immediately use the cached version of an asset, so the request for that asset immediately returns an HTTP 200 instead of an HTTP 304.
Another option would be to use an image CDN like Cloudinary to host, optimize and serve the images of this website. In that case we would completely offload to Cloudinary the responsibility of defining the caching policies for the images.
CSS and JS hosted at resources.vino.com will probably change, so it’s better to avoid the immutable directive for them, unless we implement some form of cache busting (e.g. asset fingerprinting by adding a hash to the asset filename).
Conclusion
There are several things we could try to make the home page of www.vino.com faster, leaner or more resilient:
- Self-host Google fonts, or maybe even avoid web fonts altogether and use a sans-serif system font stack like the one chosen by Booking.com.
- Self-host Font Awesome script and SVG icons, to avoid a single point of failure in page rendering.
- Use AVIF or WebP as the image format, instead of JPEG.
- Review which third-party scripts are executed before and after giving an explicit consent, and make sure there are no GDPR violations.
- Use resolution switching with images, so big images will be downloaded only when viewing the website on wide viewports.
- Optimize images on the fly using an image CDN like Cloudinary, or at build time using a tool like Jampack.
- Return a
Cache-Control: immutableheader when serving the images, so the browser can save a few costly redirects when it already has an image in cache. - Return a
Content-Security-Policyheader to mitigate XSS attacks, and maybe also a Permissions-Policy to limit which browser APIs a third-party script is allowed to access on a page. - Add a Reporting-Endpoints header to track Content-Security-Policy violations, browser crashes, deprecation warnings.
- Implement some form af cache busting for CSS and JS, so we can use
Cache-Control: immutablefor those assets too. - Be sure to avoid shipping code with known vulnerabilities, maybe by running
npm audit --audit-level=moderatein the CI pipeline. - Consider building multiple sitemaps, and see if this translates into SEO improvements.
- Consider alternatives to reCAPTCHA. It has a huge performance cost, especially on low-end mobile phones.
- Make the product images more accessible (i.e. use an
<img>element with an appropriatealtattribute).